24th May - 30th May
- Total distance: 136.71mi
- Total elevation: 4,803ft
- Longest ride: 33.25mi
- Time in saddle: 9h 53m
24th May - 30th May
17th May - 23rd May
The good: best weekly elevation yet
The bad: not as much distance as I would have liked
The ugly: a new-found anxiety, bordering on fear, on going down steep hills, in the wet, on poor road surfaces, whilst clipped in, and oh, I could go on...
10th May - 16th May
Better.
A few weeks ago I ran a survey to find out a bit more about the average RABber (partly because I was curious as to how I'll fit in, partly because I love data). The survey is now closed and amazingly, I got 113 responses, more than 11% of the field. Quite pleased with that. Anyway, the results are in; buckle up, it's a long ride with lots of graphs.
First up, frames. Very nearly three quarters of respondents have a carbon frame. Me, I'm in the 1-in-9 that have an aluminium frame (I do have carbon forks though). And as for handlebars, well, there's a very clear majority (94%!) for drop bars... but that does reassure me, at least, that I wont be the only rider on a flat bar. Also, I don't know what an Xbar is. Anyone?

Now, the drivetrain. Shimano must love RABbers, with more than four fifths of all respondents running their chainsets, and likewise their cassettes. I was going to ask about cassette configurations, but there are so many options and I got survey writers fatigue... Oh, and I assume the person that answered Tiagea meant Tiagra, in which case there's another vote for Shimano, right?

No surprises here, are there? Most riders are clipped in with some form of cleat. I should have asked how many times people have embarrassing falls due to unclipping fails (oh - just me?)

Now these next responses surprised me - I expected a higher proportion of carbon wheelsets, and a higher proportion of riders going tubeless. But alloy wheels are marginally more popular, and inner tubes are significantly more popular. Anyone else surprised by this? Oh, and I especially like the no idea response from the rider who doesn't know what their wheels are made of.

And now a couple of clear 2-to-1 (ish) results: riders prefer disc brakes to rim brakes, and puncture-resistant tyres to regular. Again, no surprises, right? Maybe I should have asked what brand of puncture-resistant, got some recommendations (except I bet they would all be Conti Gatorskins).

Now to the most interesting set of results: which days rider are most and least looking forward to. On the face of it, there's a fairly even spread, with day 9 (the finish) being the most looked forward to, and day 1 (getting started) the least looked forward to. Maybe predictable results. The interesting bit though is when you slice this data and only look at those riders who have done LEJOG before: they most look forward to day 8 and least look forward to day 4. What do they know that the rest of us don't? Scenery for day 8, maybe? Day 4 is the easiest day in terms of elevation, so why is it less anticipated? Who knows...

Transport. Unsurprisingly, given their remote locations, road is the preferred conveyance to/from the ride, with car and bus/coach figuring heavily for both legs. The train is a popular way of getting to LE too. Oh, and two thirds of respondents are treating themselves to a night in Inverness before their onward journey: the Premier Inns and Travelodges of the area must be delighted.


And now a bit about the riders. More than two thirds of survey respondents are, like me, first-timers. I should probably add that this will probably be my first and last time, but let's not pre-empt. Nearly three fifths of those surveyed are self-funded too, rather than having charity places.

Next, the prefer not to say section, AKA gender and age. RAB looks quite blokey, with more than four fifths of respondents identifying as male. Older than I expected too - if you're under 45 you're in the minority.

And finally, more than three quarters of those responding describe themselves as either novice or intermediate when it comes to this kind of long-distance cycling. Like me, in other words. Phew.

3rd - 9th May
A disappointing week, if I'm honest.
I started cycling regularly again about this time three years ago, and look how things have moved on...

2018 started slowly, then picked up as I gained enthusiasm, logged into Strava and got a bit more competitive. 2019 carried on at a similar rate, with the addition of a couple of big days to elevate things further. 2020 started off like the clappers, mindful as I was of the plan to do LEJOG in September of that year... but the advent of lockdown, and the realisation that LEJOG would be postponed soon put me in a mileage tailspin. And 2021 began in those same doldrums until, mid-February, I suddenly realised that I need to be in some kind of shape by September of this year or LEJOG will be a disaster. Hence this year's graph line is arrowing up nicely.
Another way of looking at it (and because I like graphs) is this continuous progress over three years...
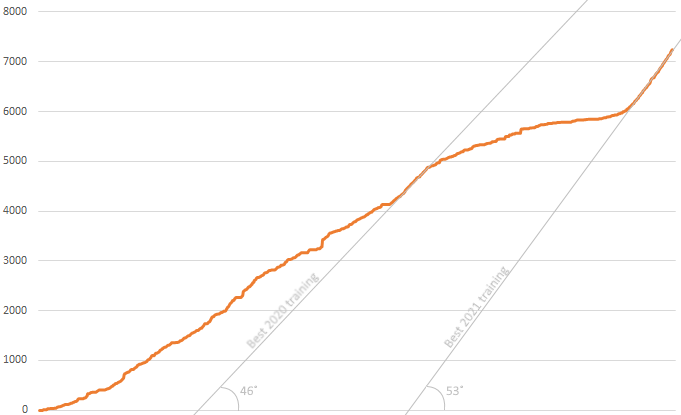
...which hopefully illustrates that my current rate of mileage is better than when I was training hard last year (and I've maintained the rate for longer). And I know the trendline angles are relatively meaningless without an x-axis scale, but they do allow comparison, and that's the point I'm trying to make, maths fans.
It also shows that I've cycled more than 7,000 miles in the last three years... which sounds a lot until you remember that LEJOG is very nearly 1,000 miles in nine days...
26th April - 2nd May