I started cycling regularly again about this time three years ago, and look how things have moved on...

I started cycling regularly again about this time three years ago, and look how things have moved on...
2018 started slowly, then picked up as I gained enthusiasm, logged into Strava and got a bit more competitive. 2019 carried on at a similar rate, with the addition of a couple of big days to elevate things further. 2020 started off like the clappers, mindful as I was of the plan to do LEJOG in September of that year... but the advent of lockdown, and the realisation that LEJOG would be postponed soon put me in a mileage tailspin. And 2021 began in those same doldrums until, mid-February, I suddenly realised that I need to be in some kind of shape by September of this year or LEJOG will be a disaster. Hence this year's graph line is arrowing up nicely.
Another way of looking at it (and because I like graphs) is this continuous progress over three years...
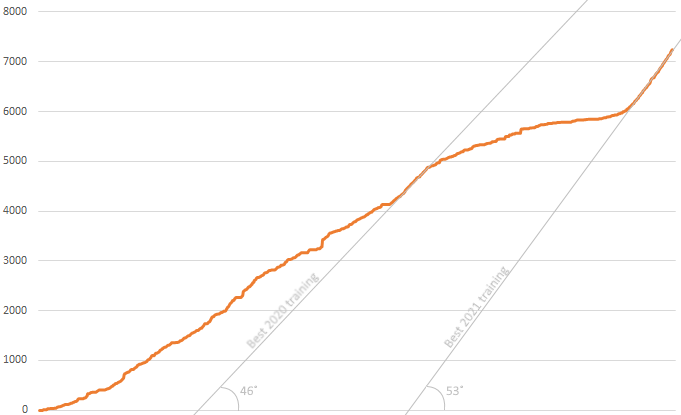
...which hopefully illustrates that my current rate of mileage is better than when I was training hard last year (and I've maintained the rate for longer). And I know the trendline angles are relatively meaningless without an x-axis scale, but they do allow comparison, and that's the point I'm trying to make, maths fans.
It also shows that I've cycled more than 7,000 miles in the last three years... which sounds a lot until you remember that LEJOG is very nearly 1,000 miles in nine days...
No comments:
Post a Comment